Financial Highlights (Consolidated)
Kawada Group performance trends and highlights
Change in Main Managerial Indicators (Consolidated)
| (Terms) | 74th term | 75th term | 第76期 | 第77期 |
|---|---|---|---|---|
| Settlement date | 2023 March |
2024 March |
2025年 3月 |
2026年 3月 |
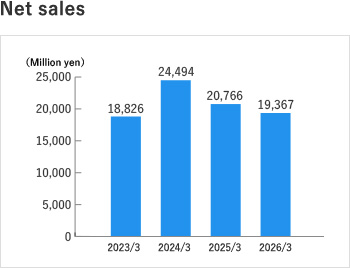
| Sales Amount (million yen) | 18,826 | 24,494 | 20,766 | 19,367 |
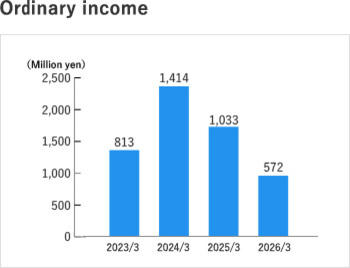
| Operating Profit (million yen) | 813 | 1,414 | 1,033 | 572 |
| Net Income returned to Parent Company Shareholders (million yen) | 351 | 929 | 576 | 36 |
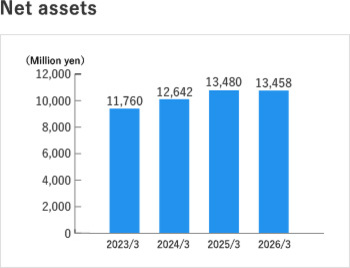
| Net Worth (million yen) | 11,760 | 12,642 | 13,480 | 13,458 |
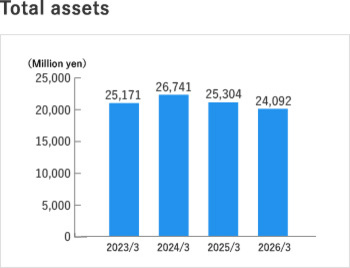
| Total Assets (million yen) | 25,171 | 26,741 | 25,304 | 24,092 |
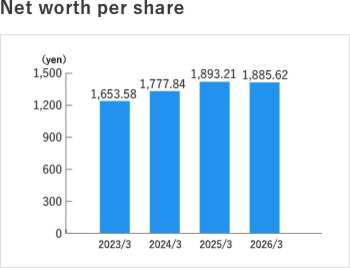
| Net Worth per Share (yen) | 1,653.58 | 1,777.84 | 1,893.21 | 1,885.62 |
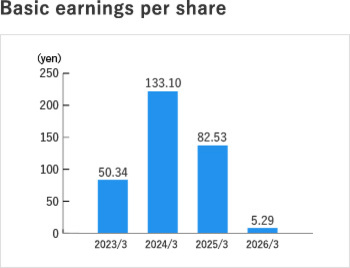
| Net Worth per Share (yen) | 50.34 | 133.10 | 82.53 | 5.29 |
| Capital Adequacy ratio (%) | 45.8 | 46.4 | 52.2 | 54.7 |
| 自己資本利益率(ROE)(%) | 3.1 | 7.8 | 4.5 | 0.3 |
| Price Earnings ratio (x) | 17.0 | 7.9 | 9.4 | 147.5 |
| Cash Flow according to Sales Activity (million yen) | 554 | △139 | 1,122 | 1,992 |
| Cash Flow according to Investment Activity (million yen) | △1,030 | △653 | △455 | △1,033 |
| Cash Flow according to Financing Activity (million yen) | 760 | 738 | △1,221 | △1,006 |
| Cash and Cash Equivalent Balance at end of year (million yen) | 7,086 | 7,040 | 6,770 | 6,709 |
| Cash Dividend per Stock (yen) | 41.00 | 41.00 | 41.00 | 38.00 |
| Dividend Payout ratio (%) | 81.4 | 30.8 | 49.7 | 717.8 |
| Dividend Payout ratio (%) | 807 (10) |
809 (8) |
802 (9) |
734 (7) |
Change in Main Managerial Indicators (units)
| (Terms) | 74th term | 75th term | 第76期 | 第77期 |
|---|---|---|---|---|
| Settlement date | 2023 March |
2024 March |
2025年 3月 |
2026年 3月 |
| Sales Amount (million yen) | 7,966 | 9,154 | 9,331 | 9,100 |
| Operating Profit (million yen) | 318 | 368 | 806 | 741 |
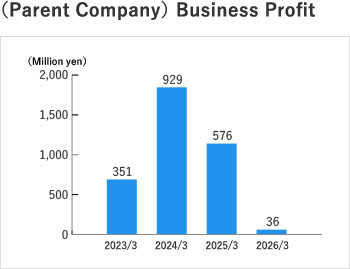
| Business Profit (million yen) | 168 | 245 | 639 | 523 |
| Capital (million yen) | 977 | 977 | 977 | 977 |
| Total Number of Issued Shares (thousand shares) | 7,210 | 7,210 | 7,210 | 7,210 |
| Net Worth (million yen) | 6,498 | 6,552 | 6,904 | 7,283 |
| Total Assets (million yen) | 13,531 | 14,251 | 13,217 | 12,910 |
| Net Worth per Share (yen) | 931.20 | 938.55 | 989.09 | 1,042.61 |
| Net Worth per Share (yen) | 24.14 | 35.17 | 91.57 | 74.99 |
| Capital Adequacy ratio (%) | 48.0 | 46.0 | 52.2 | 56.4 |
| Price Earnings ratio (x) | 35.4 | 29.9 | 8.5 | 10.4 |
| Dividend Payout ratio (%) | 169.9 | 116.6 | 44.8 | 50.7 |
| Dividend Payout ratio (%) | 238 (5) |
244 (3) |
246 (3) |
242 (2) |
(Notes)
- Consumption tax and regional consumption tax are not included in sales.
- △ indicates loss or excess expenditure.
- The number of employees shows the number of workers employed. In addition, () are temporary employees, they are external number.